Tuesday, January 14, 2014

BULLISH PIERCING LINE & BEARISH DARK CLOUD COVER


BULLISH PIERCING LINE: A down candlestick in a downtrend, the second candlestick opens at a new low, with a gap down and closes more than halfway into the prior down body, the first candlestick is a normal or long down candlestick, the second candlestick opens well below the close of the first candlestick and close more than halfway into the prior down candlestick’s body, the close of the second candlestick must stay inside the body of the first candlestick. Prices must cross above the last close for confirmation.

BEARISH DARK CLOUD COVER: An up candlestick in an uptrend, the second candlestick opens at a new high, with a gap up and closes more than halfway into the prior up body, the first candlestick is a normal or long up candlestick, the second day open above the close of the first candlestick and close more than halfway into the prior up candlestick’s body, the close of the second candlestick must stay inside the body of the first candlestick. Prices must cross below the last close for confirmation. 

Monday, January 13, 2014

ACCUMULATION DISTRIBUTION LINE


ACCUMULATION DISTRIBUTION LINE: is designed to measure the cumulative flow of money into and out of a security. First, a multiplier is calculated based on the relationship of the close to the high-low range, second, the Money Flow Multiplier is multiplied by the period's volume to come up with a Money Flow Volume. Chartists can use this indicator to affirm a security's underlying trend or anticipate reversals when the indicator diverges from the security price. A bullish divergence forms when price moves to new lows but the Accumulation Distribution Line does not confirm these lows and moves higher; a bearish divergence forms when price moves to new highs but the Accumulation Distribution Line does not confirm and moves lower.

INVERTED HAMMER & SHOOTING STAR

BULLISH INVERTED HAMMER: a down body followed by an Inverted Hammer that with a long upper shadow and a small body (similar in shape to the Bearish Shooting Star but unlike the Shooting Star), the Inverted Hammer appears in a downtrend, signal of a bullish reversal. The body of the Inverted Hammer is small, the upper shadow is at least twice as long as the body but not shorter than an average candlestick length, no or a very tiny lower shadow, the bottom of the inverted hammer is higher than the preceding candlestick’s body, prices must cross above the midpoint of the upper shadow of the inverted hammer for confirmation. 

BEARISH SHOOTING STAR: an up body followed by an Inverted Hammer with a long upper shadow and a small body (similar in shape to the Bullish Inverted Hammer pattern but unlike it), the Shooting Star appears in an uptrend, signal of a bearish reversal. The body of the Inverted Hammer is small, the upper shadow is at least twice as long as the body but not shorter than an average candlestick length, no or a very tiny lower shadow, the top of the Inverted Hammer’s body is higher than the preceding candlestick’s body, prices must cross below the low of the Inverted Hammer’s body for confirmation. 

Sunday, January 12, 2014

ACCELERATOR OSCILLATOR


ACCELERATOR OSCILLATOR: is developed from the Awesome Oscillator, showing the difference between the Awesome Oscillator and the 5-period moving average, showing the speed of change of the Awesome Oscillator, which can be useful to find trend reversals before the Awesome Oscillator does. Accelerator Oscillator is higher than the zero line: the upward movement, Accelerator Oscillator is below the zero line:  the downward movement. Two green (up) bars (one after the other) and the AC is above the zero line: market rises; two red (down) bars (one after the other) and the AC is below the zero line: market declines; the AC is below the zero line, there should be at least three green bars appearing below the zero line to confirm a long position; the AC is above the zero line, there should be at least three red above the zero line to confirm a short position. 


//+------------------------------------------------------------------+
//|                                                  Accelerator.mq4 |
//|                      Copyright © 2005, MetaQuotes Software Corp. |
//|                                       http://www.metaquotes.net/ |
//+------------------------------------------------------------------+
#property  copyright "Copyright © 2005, MetaQuotes Software Corp."
#property  link      "http://www.metaquotes.net/"
//---- indicator settings
#property  indicator_separate_window
#property  indicator_buffers 3
#property  indicator_color1  Black
#property  indicator_color2  Green
#property  indicator_color3  Red
//---- indicator buffers
double     ExtBuffer0[];
double     ExtBuffer1[];
double     ExtBuffer2[];
double     ExtBuffer3[];
double     ExtBuffer4[];
//+------------------------------------------------------------------+
//| Custom indicator initialization function                         |
//+------------------------------------------------------------------+
int init()
  {
//---- 2 additional buffers are used for counting.
   IndicatorBuffers(5);
//---- drawing settings
   SetIndexStyle(0,DRAW_NONE);
   SetIndexStyle(1,DRAW_HISTOGRAM);
   SetIndexStyle(2,DRAW_HISTOGRAM);
   IndicatorDigits(Digits+2);
   SetIndexDrawBegin(0,38);
   SetIndexDrawBegin(1,38);
   SetIndexDrawBegin(2,38);
//---- 4 indicator buffers mapping
   SetIndexBuffer(0,ExtBuffer0);
   SetIndexBuffer(1,ExtBuffer1);
   SetIndexBuffer(2,ExtBuffer2);
   SetIndexBuffer(3,ExtBuffer3);
   SetIndexBuffer(4,ExtBuffer4);
//---- name for DataWindow and indicator subwindow label
   IndicatorShortName("AC");
   SetIndexLabel(1,NULL);
   SetIndexLabel(2,NULL);
//---- initialization done
   return(0);
  }
//+------------------------------------------------------------------+
//| Accelerator/Decelerator Oscillator                               |
//+------------------------------------------------------------------+
int start()
  {
   int    limit;
   int    counted_bars=IndicatorCounted();
   double prev,current;
   //---- last counted bar will be recounted
   if(counted_bars>0) counted_bars--;
   limit=Bars-counted_bars;
   //---- macd counted in the 1-st additional buffer
   for(int i=0; i<limit; i++)
      ExtBuffer3[i]=iMA(NULL,0,5,0,MODE_SMA,PRICE_MEDIAN,i)-iMA(NULL,0,34,0,MODE_SMA,PRICE_MEDIAN,i);
   //---- signal line counted in the 2-nd additional buffer
   for(i=0; i<limit; i++)
      ExtBuffer4[i]=iMAOnArray(ExtBuffer3,Bars,5,0,MODE_SMA,i);
   //---- dispatch values between 2 buffers
   bool up=true;
   for(i=limit-1; i>=0; i--)
     {
      current=ExtBuffer3[i]-ExtBuffer4[i];
      prev=ExtBuffer3[i+1]-ExtBuffer4[i+1];
      if(current>prev) up=true;
      if(current<prev) up=false;
      if(!up)
        {
         ExtBuffer2[i]=current;
         ExtBuffer1[i]=0.0;
        }
      else
        {
         ExtBuffer1[i]=current;
         ExtBuffer2[i]=0.0;
        }
       ExtBuffer0[i]=current;
     }
   //---- done
   return(0);
  }
//+------------------------------------------------------------------+

HARAMI


BULLISH HARAMI: a down body and a small up body that is completely inside the range of the down body (looks like a pregnant woman), a prevailing downtrend, the first candlestick is a normal or long down candlestick, heavy selling, the next candlestick opens higher or at the close of the former one, signaling a trend reversal since the second candlestick is small, that the bearish power is diminishing, prices must cross above the last close for confirmation.

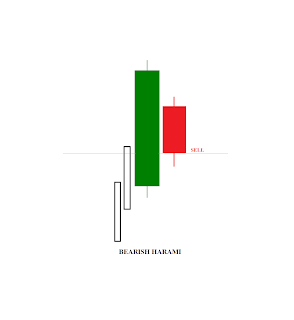
BEARISH HARAMI: an up body and a small down body that is completely inside the range of the up body (looks like a pregnant woman), a prevailing uptrend, the first candlestick is a normal or a long up candlestick, heavy buying, the next candlestick opens lower or at the close of the former one, The confirmation level is defined as the last close or the midpoint of the first white body, whichever is lower. Prices must cross the last close for confirmation. 

BULLISH HARAMI CROSS: looks like a pregnant woman, the baby is a Doji,  a down candlestick followed by a Doji that is completely inside the range of the prior down body, the body of the first candlestick may be short, a bearish mood prevails in the market, a downtrend is in progress. If the first down body is short, the confirmation level is the body top of the first candlestick. If the first down body is not short, the confirmation level will the last close or the midpoint of the down body of the first candlestick. Prices must cross above these levels for confirmation.

BEARISH HARAMI CROSS: looks like a pregnant woman, the baby is a Doji, an up body followed by a Doji that is completely inside the range of the prior up body, the body of the first candlestick may be short, a bullish mood prevails in the market, an uptrend is in progress. If the first up body is short, the confirmation level is the body bottom of the first candlestick. If the first up body is not short, the confirmation level will the last close or the midpoint of the up body of the first candlestick, prices must cross below these levels for confirmation.